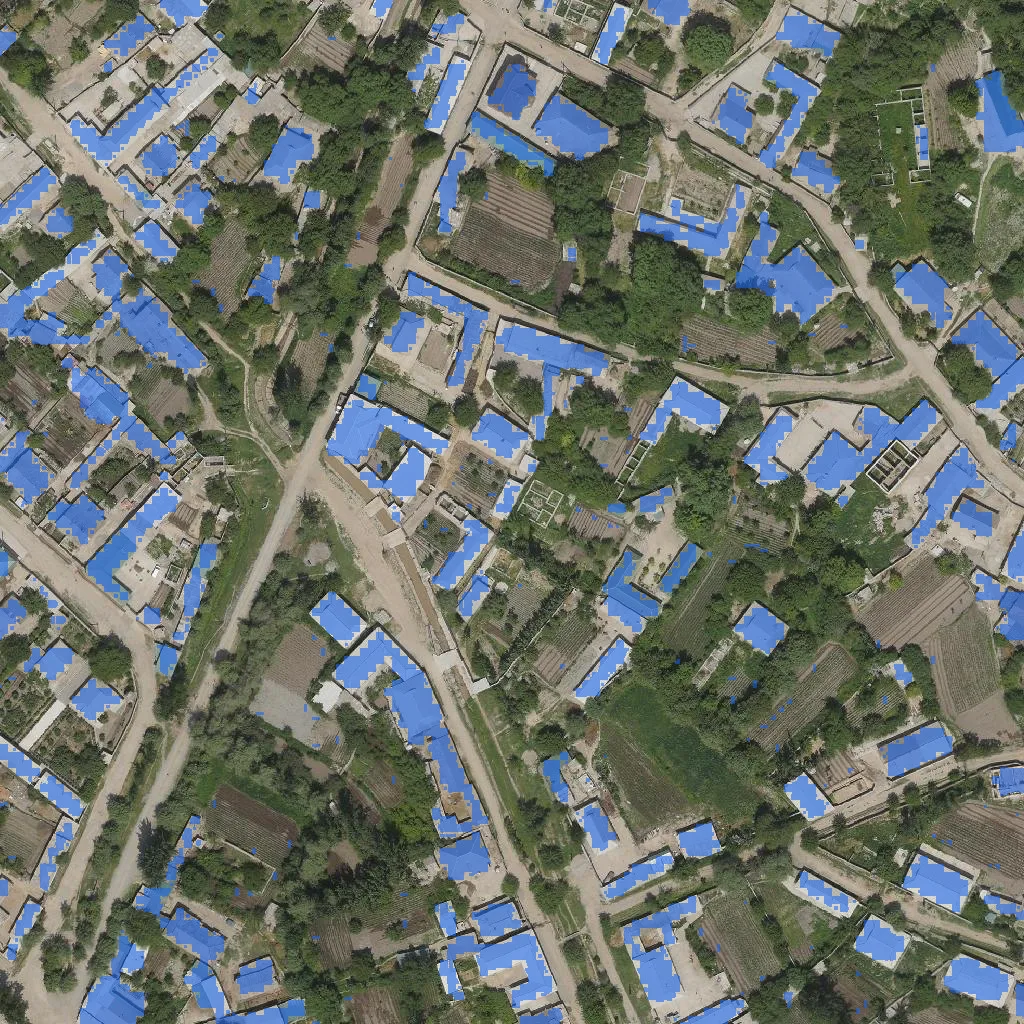
01 · Map
What is on this land?
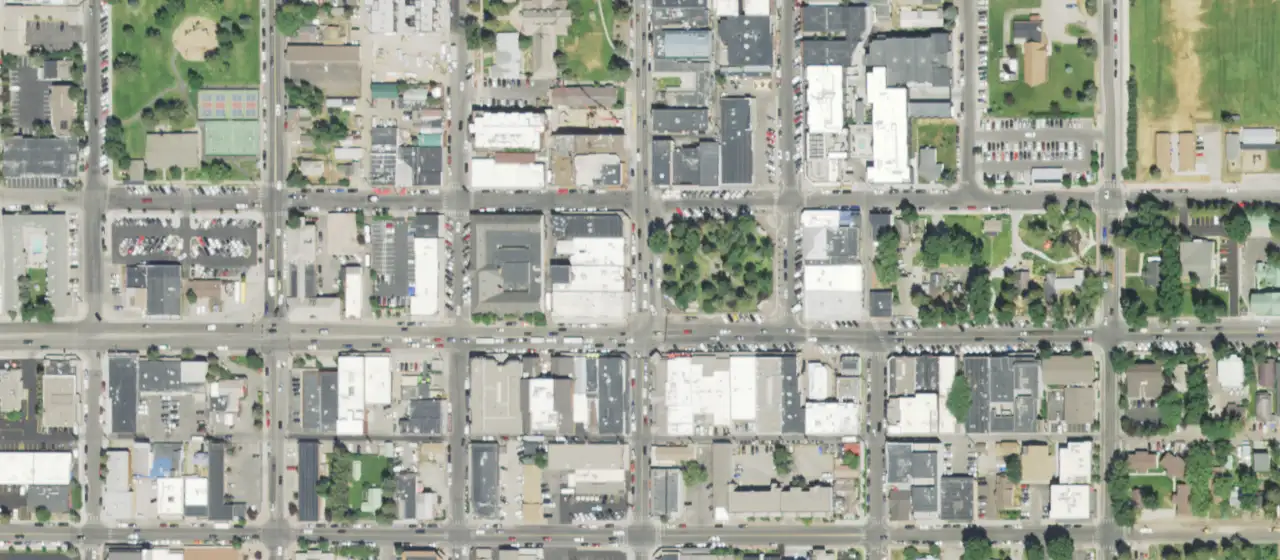
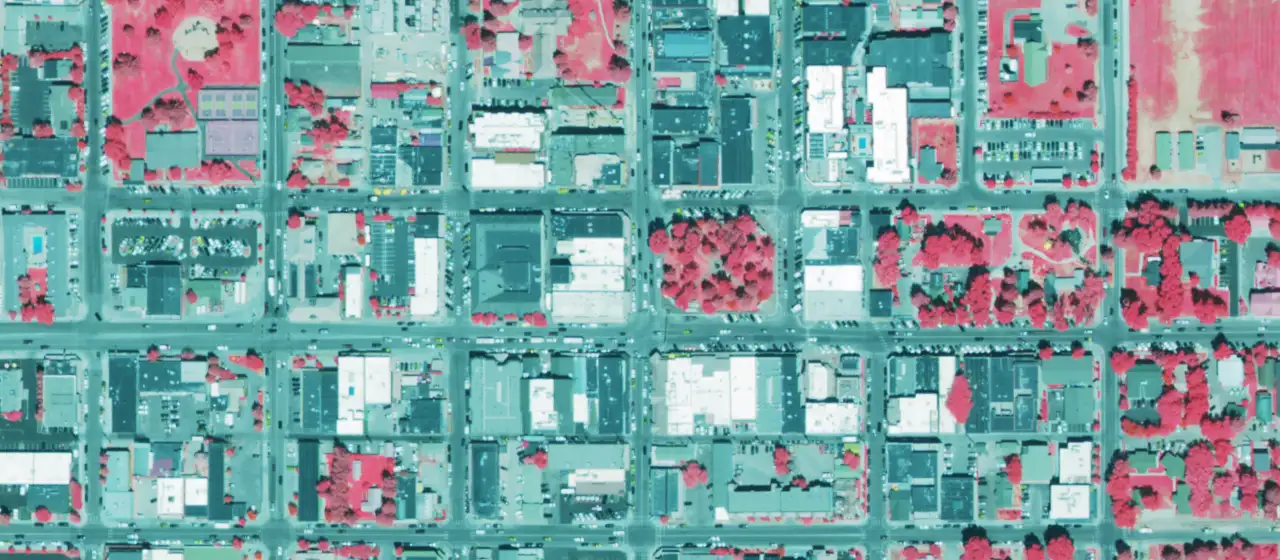
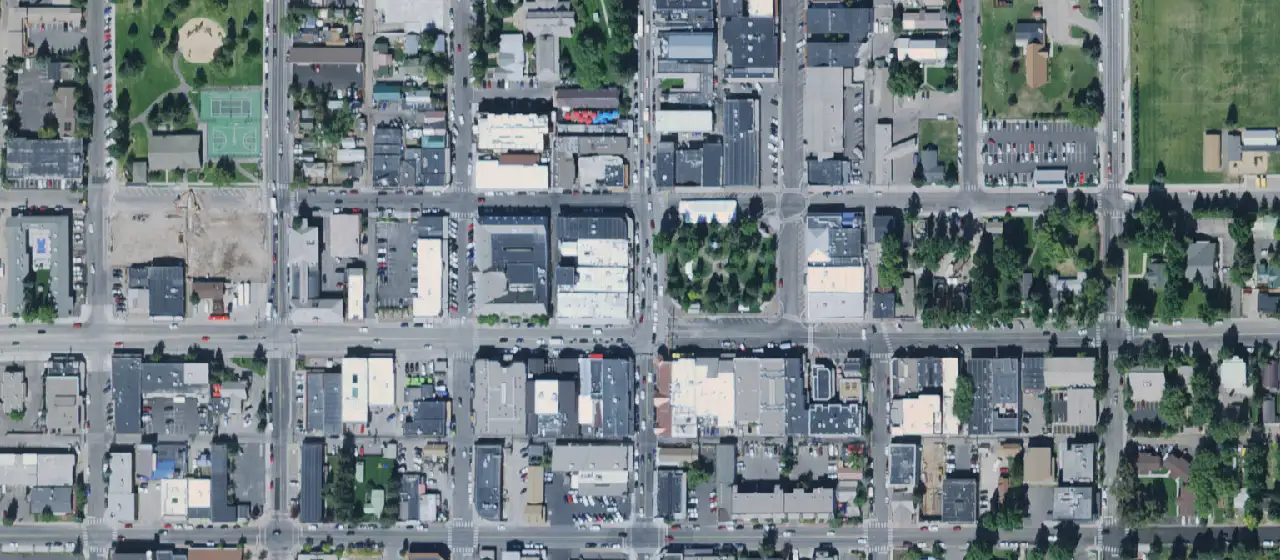
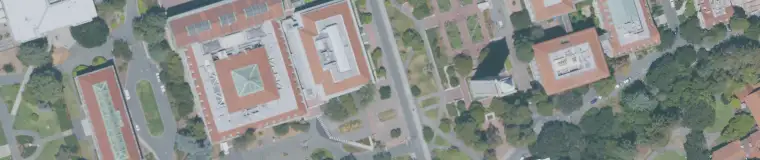
It draws the map from the pixels up. Every rooftop, road, field, and pond, labeled and measured, ready to check against a permit or a claim.
- optical
- radar
- elevation
Land cover · Buildings · Roads

The universal geospatial model
Point Locamage at imagery from any satellite, plane, drone, or street camera and ask in the words you already use. It reads the scene and answers.
Reads optical
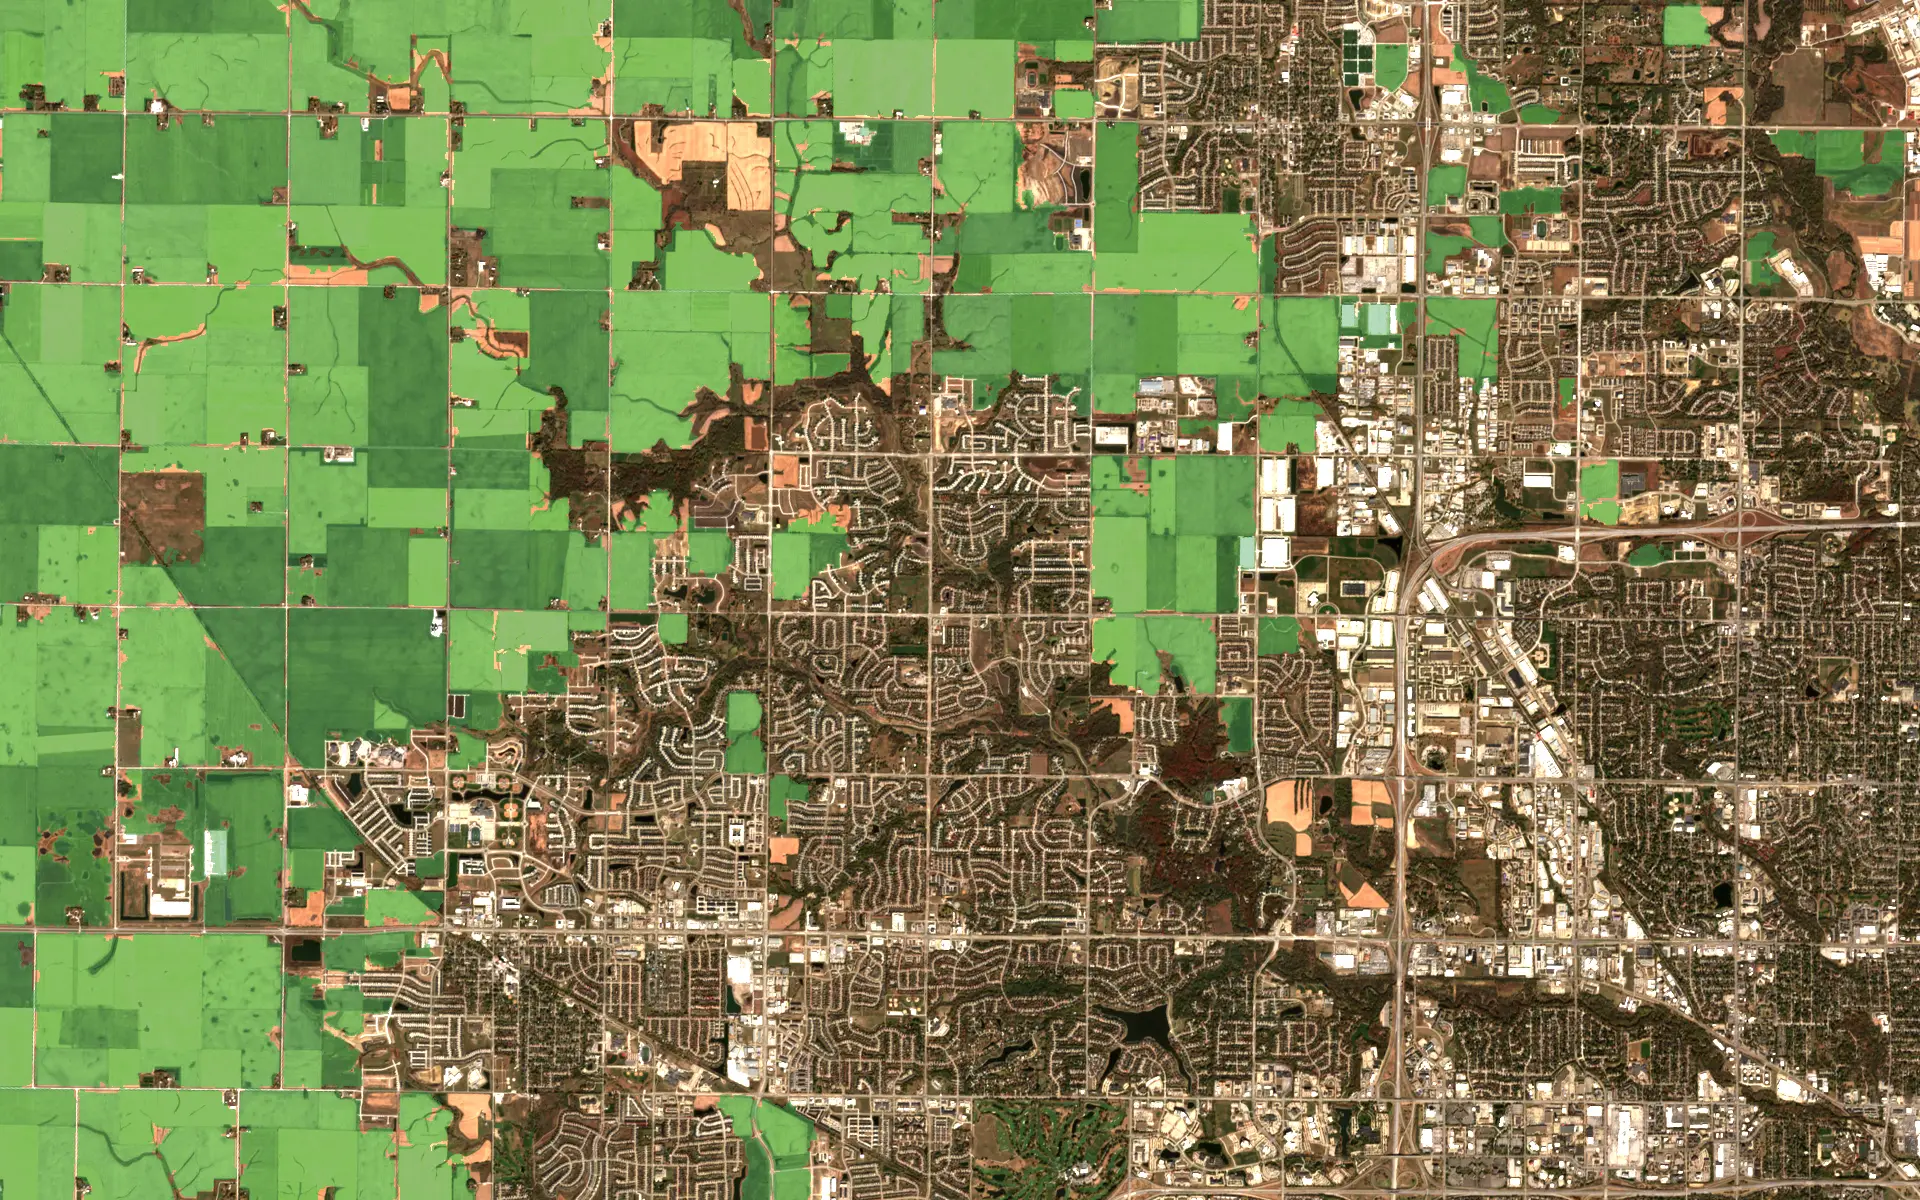
Question
Where does each field end?
Every parcel in the scene is outlined from a single October pass, harvested and standing fields alike. The boundaries follow the real edge of each field, not the survey grid, and carry over to the next revisit.
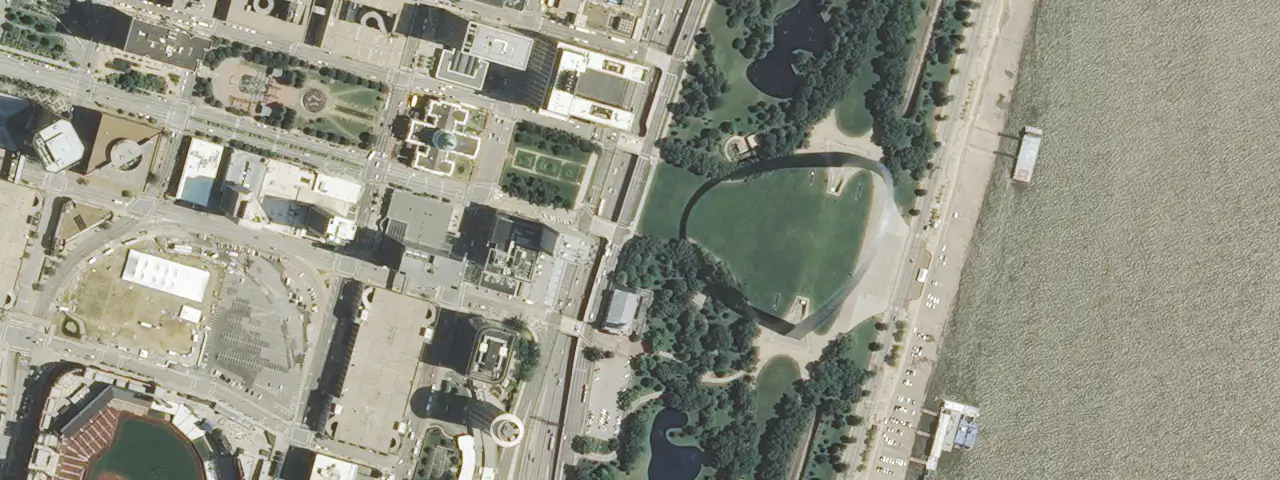
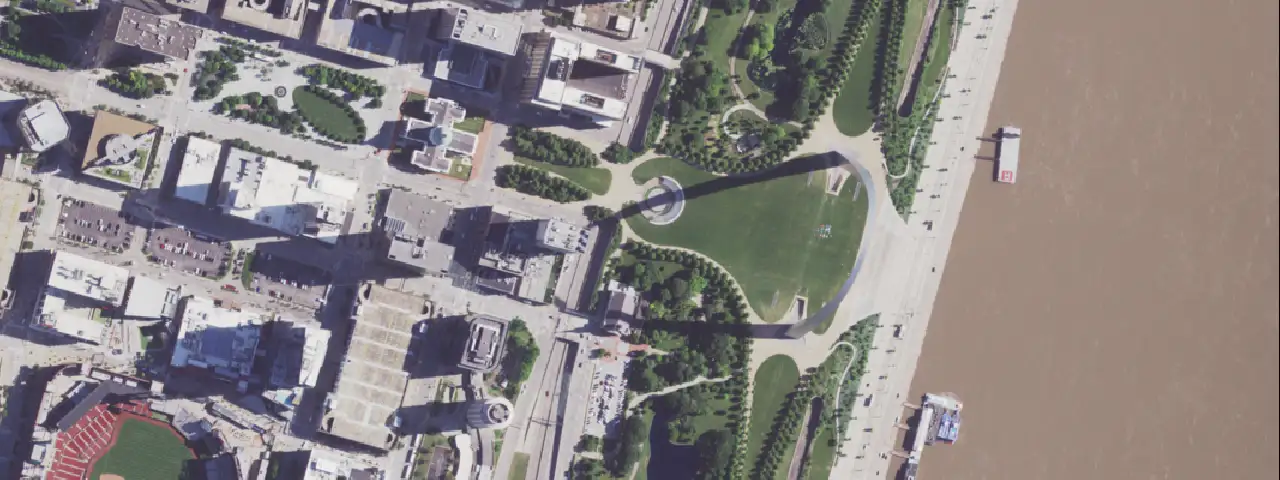 20222012
What it does
Map, monitor, find, compare, measure. The same model handles all of it, whatever satellite, plane, or drone took the picture.
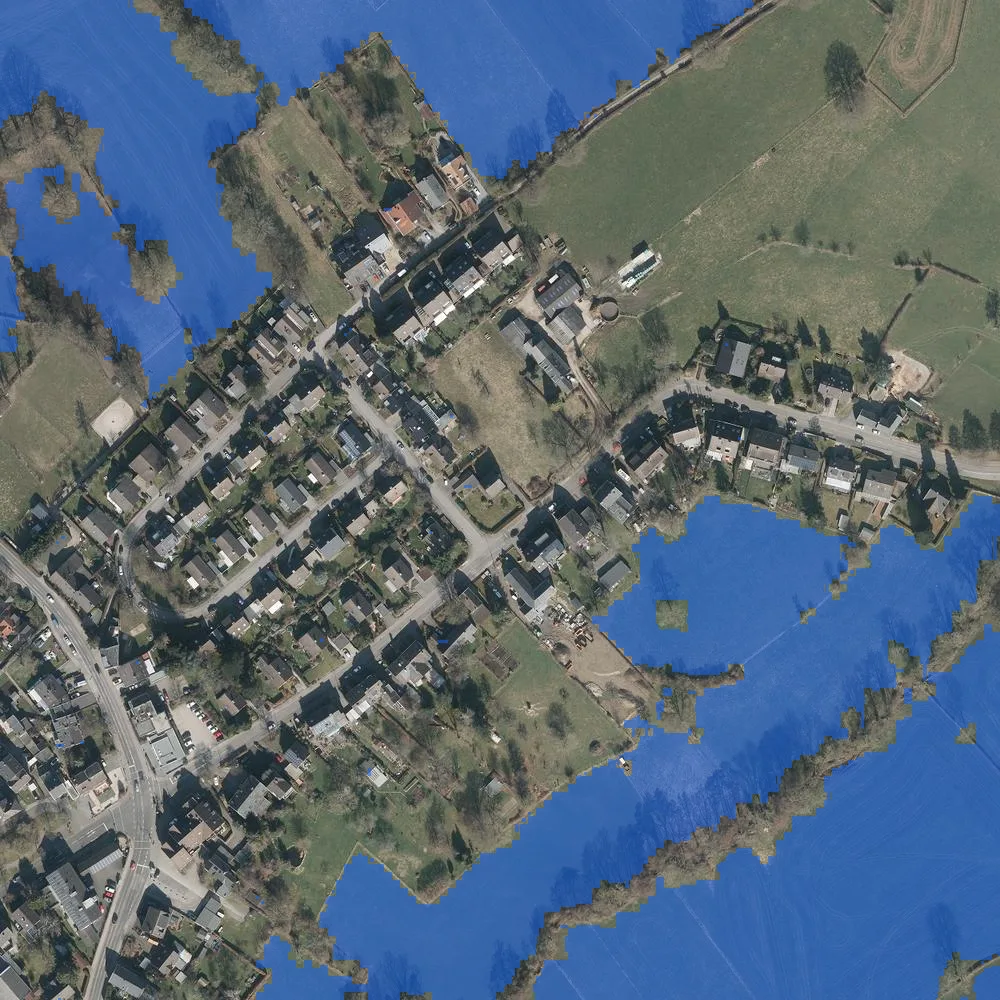
01 · Map
It draws the map from the pixels up. Every rooftop, road, field, and pond, labeled and measured, ready to check against a permit or a claim.
Land cover · Buildings · Roads
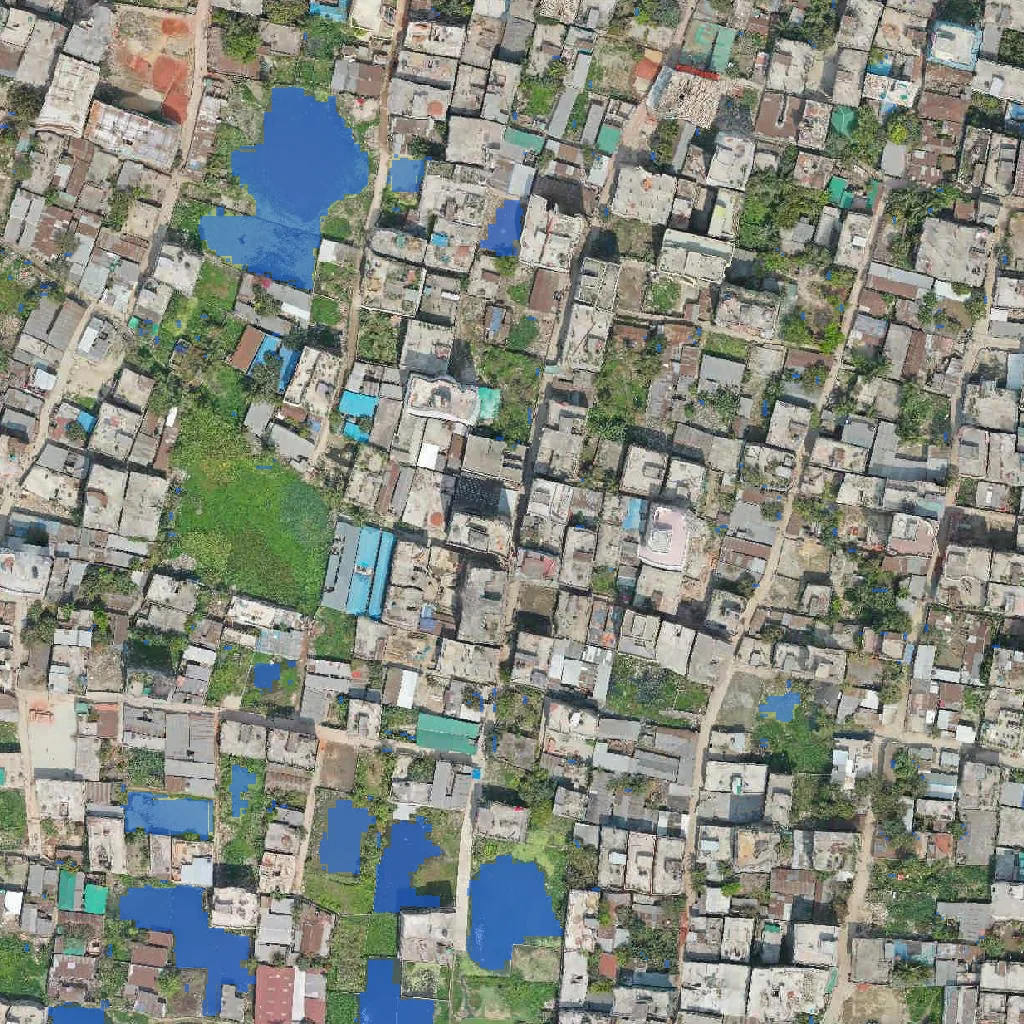
02 · Monitor
It reads every field the way an agronomist would, all of them at once, week after week. Stress and patchy growth get flagged while there is still time to act.
Crops · Forests · Water
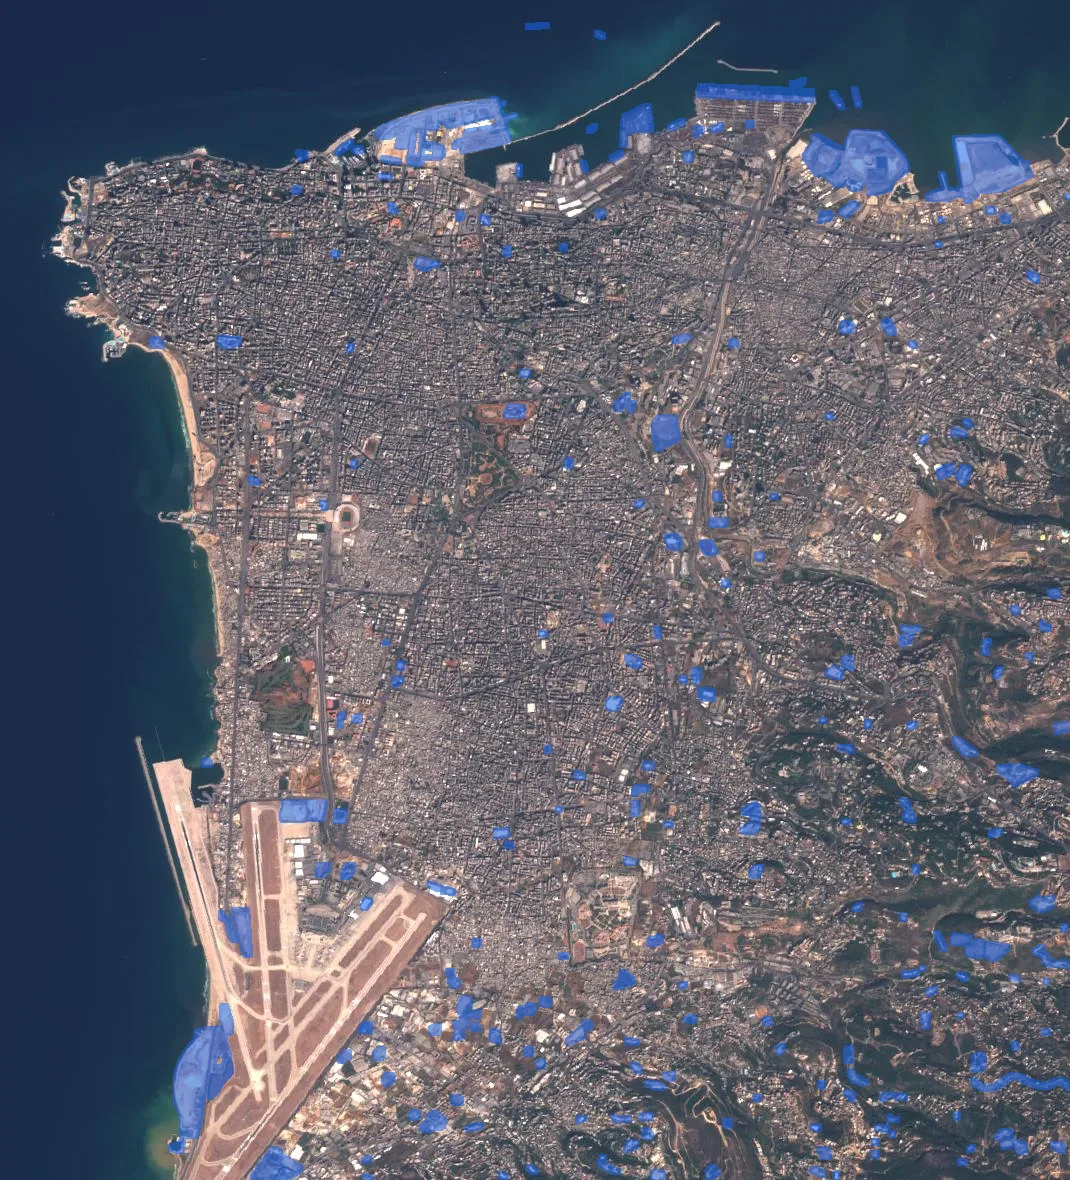
03 · Find
Describe what you are hunting for, ponds, solar panels, new construction, and it checks every acre in the region, then marks the hits.
Water · Solar · Construction
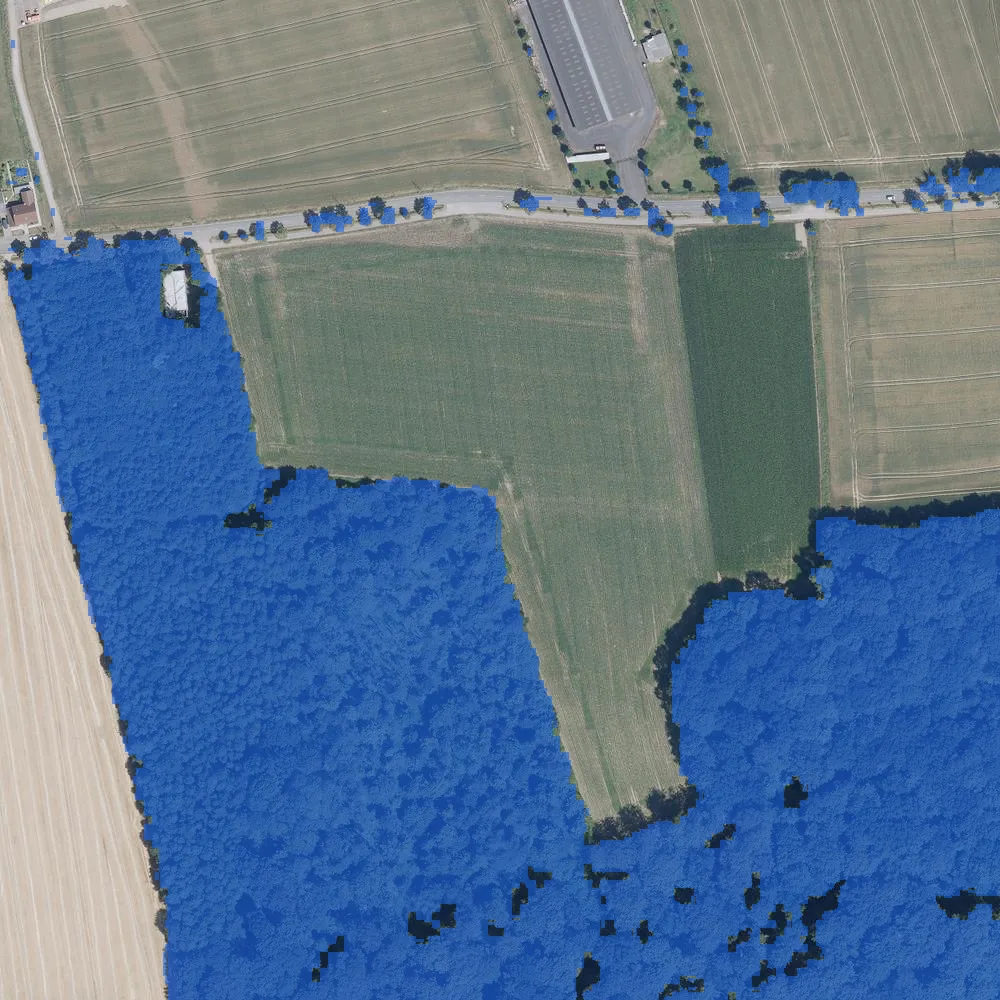
04 · Compare
Give it two dates, or every pass in the archive, and it outlines what actually moved. Clouds and shifting light get ignored.
Two dates · Whole archive
05 · Measure
Some questions end in a number. It measures from orbit and shows you where the number came from.
Acres · Biomass · Extent
The model
Most Earth AI is built for one satellite and falls apart on the next. Locamage was built the other way around.
One model reads them together.
Plain words: where to look, what changed, and what to do about it.
01Optical
street level to whole-country mosaics
02Radar
structure through cloud and darkness
03Hyperspectral
hundreds of bands past visible light
04Elevation
terrain read as part of the scene
05Revisits
the same acre, week after week
06Unseen sensors
new feeds read on arrival, no retraining
It learned from imagery covering the whole planet, so an unsurveyed region reads as well as a mapped one.
Mark a few examples of the thing you track and it maps the rest using your labels.
The imagery you already pay to store turns into a queryable history of any acre.
Request access
Tell us what imagery you have and what you need to know from it. You will get a straight answer about whether Locamage fits.