
Every day, hundreds of sensors photograph the Earth. Radar sees through clouds, multispectral satellites track how crops are doing, aerial cameras pick out single rooftops, and drones can map a field down to the centimeter. Yet most models built on this imagery understand only one of them. There is a model for the European Space Agency’s Sentinel-2 satellites, another for aerial photos, another for radar, and each stays inside its own sensor and resolution.
We would rather build one model that handles all of it, whatever the sensor, the resolution or the place. Finch 1 is our first step. We trained it on imagery from more than 50 sensors on satellites, planes and drones, ranging from 4.4 mm drone photos to 250 m MODIS. It reads optical, multispectral, hyperspectral, synthetic aperture radar, thermal and elevation data. Hand it whatever imagery you have for a place and you get back 1024-dimensional embeddings at that imagery’s resolution.
4.4 mmDrone
0.2 mAerial
3 mPlanetScope
10 mSentinel-2
30 mLandsat
250 mMODIS
Finch 1 is our most capable model yet, and we think it sets a new frontier for geospatial foundation models. Today we are sharing benchmark results for the first, smaller version of Finch 1 and opening early access to a small group of partners.
NAIP aerial, 0.6 m, about 300 m across
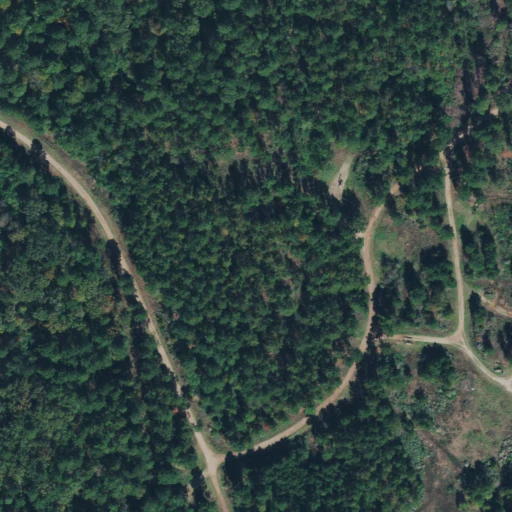
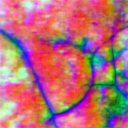 ImageryFinch, from aerial
Sentinel-2, 10 m, 2.4 km across
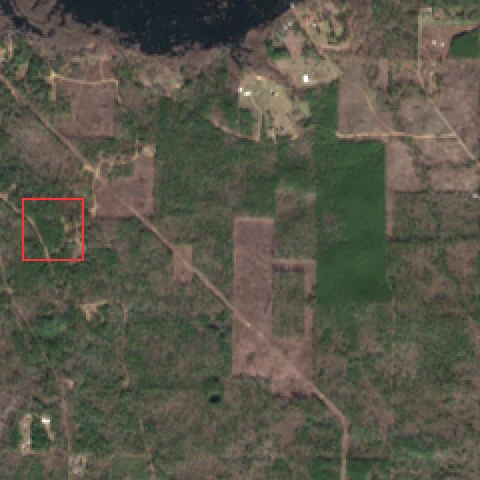
 ImageryFinch, from Sentinel-2
Why one model
Most geospatial foundation models learn from a handful of low-resolution satellites, so the only way to improve them is to feed them more of the same archives. A model that learns across sensors has a lot more to work with. Radar fills the gaps where clouds block the optical view, aerial photos add detail no satellite can resolve, and hyperspectral and thermal bands pick up things the eye cannot. Since it all ends up in one embedding space, labels you collect with one sensor carry over to the others, and a new sensor does not mean training a new model.
Our bet with Finch is that this variety is the thing worth scaling. So far, the results back that up.
Results
We tested Finch on 32 public tasks drawn from three benchmark suites: OlmoEarth, UniverSat and GEO-Bench-2. The imagery comes from seven kinds of sources, from sub-meter aerial photos to 30 m Landsat, and the tasks cover crop types, land cover, floods, burn scars, marine debris, solar panels, buildings, tree species and urban change. We kept the encoder frozen throughout and trained only a kNN classifier or a linear probe on top.
Four tasks where Finch leads a published result.
Finch 1Published result
Crop mapping from radar
vs OlmoEarth v1.2
70.858.2+12.6
PASTIS crop mapping
vs AlphaEarth
50.439.1+11.3
Deforestation drivers
vs UniverSat-B
47.941.7+6.2
Marine debris and oil spills
vs OlmoEarth v1.3
72.067.1+4.9
| Compared with | Tasks | Finch | Other model | Tasks Finch ahead on |
|---|---|---|---|---|
| OlmoEarth v1.3 Base, on the OlmoEarth suite | 18 | 65.1 | 65.5 | 6 |
| OlmoEarth v1.2 Base, on the OlmoEarth suite | 18 | 65.1 | 65.6 | 6 |
| UniverSat-B, on the UniverSat suite | 9 | 65.9 | 66.1 | 5 |
| AlphaEarth Foundations | 1 | 50.4 | 39.1 | 1 |
Mean scores in percent, over tasks where both models have a comparable result, at each benchmark’s standard patch size. When Finch picks its patch size for each task using the validation set alone, its averages rise to 65.7 on the OlmoEarth suite and 66.4 on the UniverSat suite, slightly ahead of OlmoEarth and UniverSat-B.
A new provider and region. TreeSatAI’s aerial imagery comes from a data provider and a region that were not in Finch’s pretraining data, and we did not fine-tune on it. With the encoder frozen, a linear probe on Finch’s embeddings reaches 33.0 macro F1 across 15 tree species. We found no published score that uses only the aerial input with a frozen encoder and a linear probe, so we report this one on its own. We would expect it to improve with fine-tuning or by adding this region to pretraining.
On OlmoEarth’s own suite. Finch beats OlmoEarth v1.3 on 6 of its 18 tasks, with the biggest leads on crop mapping from Sentinel-1 radar (CropHarvest China, +8.4), So2Sat local climate zones (+5.2), marine debris and oil spills (MADOS, +4.9) and deforestation drivers from Landsat (+4.9). It is also ahead on cashew plantations and EuroSAT land cover. Over all 18 tasks, Finch averages 65.1 to OlmoEarth’s 65.5, less than half a point apart, and 65.7 when it picks its patch size for each task on validation.
Against AlphaEarth’s embeddings. On PASTIS crop mapping, Finch scores 50.4 against 39.1 for AlphaEarth’s embeddings, an 11.3-point lead, while reading only Sentinel-2. AlphaEarth draws on Sentinel-1 and other sources as well.
On UniverSat’s own suite. Finch wins 5 of UniverSat-B’s 9 tasks and averages 65.9 to its 66.1, or 66.4 when it picks its patch size for each task on validation. Its biggest leads are on deforestation drivers from Landsat (+6.2), tree crowns in 10 cm aerial imagery (m-NeonTree, +3.2) and solar panels (+1.0), and it is also ahead on smallholder field boundaries and brick kilns.
At high resolution. With only a linear probe, Finch beats TerraMind v1 Large on DynamicEarthNet, 32.9 to 31.7, even though TerraMind trains a decoder of about 20M parameters. On FLAIR2 aerial land cover it is within 0.9 points of DINOv3 ConvNeXt-L, which uses a trained UNet of about 16M.
Where we are closing the gap. On OlmoEarth’s suite, Finch is ahead or within 3 points on 14 of the 18 tasks, and most of the remaining gap comes from CropHarvest Togo and PASTIS crop segmentation. At high resolution, the best published numbers come from much larger models or trained decoders, while we use a single linear layer. Both gaps have been shrinking as we scale Finch.
How we compared
- We include a published number only when its setup matches ours, or when every difference favors the other model, such as a stronger decoder, more input sources or more training data.
- Every other model’s score is taken from its own paper or leaderboard. We did not re-run anyone else’s model.
- Finch is a patch-based model whose patch size can vary, and its embeddings have 1024 dimensions. The tables use each benchmark’s standard patch size. Where we also report Finch with its patch size chosen per task, the choice uses the validation set only, never test. On every task the encoder stays frozen, and we read the embeddings with kNN or a single linear layer of about 4K to 3.4M parameters, depending on the task’s classes and output resolution. Some baselines use far heavier readouts. The GEO-Bench-2 results train a UNet decoder, with a feature-pyramid neck for ViT encoders, of about 15M to 20M parameters. GEO-Bench-2 does not publish the UNet’s channels, so we count them with the channels in its authors’ public UNet configs.
- For OlmoEarth, we compare against the strongest published model of each version, ranked by its 18-task mean. We also ran the released OlmoEarth v1.3 Base weights through our own evaluation code and got 65.35, against its published 65.45, so our setup reproduces its numbers.
- We left out comparisons where the setups differ in a way that could favor Finch, and results produced with an evaluation process different from ours.
Full results
Bold marks the best score in each row. The Finch readout column shows what is trained on the frozen Finch embeddings for each task: kNN, which has no trained parameters, or a single linear layer with its number of trainable parameters. The readout columns for the other models show what they trained on their own features, with sizes as reported in their papers, leaderboards or code.
OlmoEarth research suite. kNN for single-image classification, linear probe otherwise.
| Task | Imagery | Finch | OlmoEarth v1.3 Base | OlmoEarth v1.2 Base | Finch readout | OlmoEarth readout |
|---|---|---|---|---|---|---|
| BreizhCrops | Sentinel-2 | 72.1 | 73.2 | 73.3 | Linear, 11K | Linear, 8.5K |
| CropHarvest China | Sentinel-1 | 70.8 | 62.4 | 58.2 | Linear, 4.1K | Linear, 3.1K |
| CropHarvest China | Sentinel-2 | 74.7 | 77.7 | 76.7 | Linear, 4.1K | Linear, 3.1K |
| CropHarvest China | Sentinel-1 + 2 | 77.1 | 78.3 | 77.7 | Linear, 4.1K | Linear, 3.1K |
| CropHarvest Togo | Sentinel-1 | 69.3 | 72.9 | 74.8 | Linear, 4.1K | Linear, 3.1K |
| CropHarvest Togo | Sentinel-2 | 79.4 | 82.0 | 81.4 | Linear, 4.1K | Linear, 3.1K |
| CropHarvest Togo | Sentinel-1 + 2 | 74.8 | 80.1 | 81.0 | Linear, 4.1K | Linear, 3.1K |
| m-bigearthnet | Sentinel-2 | 64.0 | 66.1 | 65.5 | kNN | kNN |
| m-brick-kiln | Sentinel-2 | 95.3 | 96.8 | 93.7 | kNN | kNN |
| m-cashew-plant | Sentinel-2 | 30.6 | 29.1 | 29.6 | Linear, 115K | Linear, 86K |
| m-eurosat | Sentinel-2 | 93.7 | 93.4 | 92.3 | kNN | kNN |
| m-forestnet | Landsat 8 | 46.6 | 41.7 | 45.4 | kNN | kNN |
| m-SA-crop-type | Sentinel-2 | 30.6 | 32.8 | 32.0 | Linear, 164K | Linear, 123K |
| m-so2sat | Sentinel-2 | 63.4 | 58.2 | 67.3 | kNN | kNN |
| MADOS | Sentinel-2 | 72.0 | 67.1 | 67.2 | Linear, 246K | Linear, 185K |
| PASTIS | Sentinel-1 | 29.0 | 32.6 | 31.1 | Linear, 312K | Linear, 234K |
| PASTIS | Sentinel-2 | 50.4 | 54.4 | 54.2 | Linear, 312K | Linear, 234K |
| Sen1Floods11 | Sentinel-1 | 77.8 | 79.3 | 78.9 | Linear, 33K | Linear, 25K |
| Mean | 65.1 | 65.5 | 65.6 |
UniverSat suite. UniverSat protocol: kNN for classification, linear probe for segmentation.
| Task | Imagery | Finch | UniverSat-B | Finch readout | UniverSat-B readout |
|---|---|---|---|---|---|
| AI4Farms | Sentinel-2 | 41.8 | 41.1 | Linear, 35K | Linear, 3.1K |
| BurnScars | HLS | 72.2 | 81.5 | Linear, 35K | Linear, 3.1K |
| m-chesapeake | NAIP aerial | 63.9 | 64.7 | Linear, 461K | Linear, 346K |
| m-forestnet | Landsat 8 | 47.9 | 41.7 | kNN | kNN |
| m-pv4ger | Aerial RGB | 93.7 | 92.7 | kNN | kNN |
| Sen1Floods11 | Sentinel-1 | 77.8 | 80.1 | Linear, 133K | Linear, 3.1K |
| m-NeonTree | Aerial RGB, 0.1 m | 54.2 | 51.0 | Linear, 3.28M | Linear, 26K |
| m-brick-kiln | Sentinel-2 | 94.7 | 94.5 | kNN | kNN |
| PASTIS | Sentinel-1 + 2 | 47.3 | 47.9 | Linear, 330K | Linear, 17K |
| Mean | 65.9 | 66.1 |
High-resolution tasks. These are Finch’s scores on five GEO-Bench-2 tasks, from 0.2 m aerial photos and WorldView-3 multispectral to 3 m PlanetScope, using a single linear layer on frozen embeddings. GEO-Bench-2’s published results train a UNet decoder and average five runs, which is a different setup, so we list Finch on its own.
| Task | Imagery | Finch | Finch readout |
|---|---|---|---|
| FLAIR2 | Aerial, 0.2 m | 48.9 | Linear, 3.41M |
| SpaceNet2 | WorldView-3 | 77.7 | Linear, 525K |
| SpaceNet7 | PlanetScope, 3 m | 54.9 | Linear, 525K |
| DynamicEarthNet | PlanetScope, 3 m | 32.9 | Linear, 1.84M |
| TreeSatAI (macro F1) | Aerial, 0.2 m | 33.0 | Linear, 17K |
Embedding products. Published results for AlphaEarth Foundations’ embeddings with a setup comparable to ours.
| Task | Imagery | Finch | AlphaEarth | Finch readout | AlphaEarth readout |
|---|---|---|---|---|---|
| PASTIS | Sentinel-2 | 50.4 | 39.1¹ | Linear, 312K | Linear, 1.2K |
¹Reported in the OlmoEarth v1.3 paper: a linear probe on AlphaEarth’s annual embeddings, which draw on Sentinel-1, Sentinel-2 and further sources. Finch reads Sentinel-2 only for this benchmark.
What comes next
Next, we are scaling Finch to more sensors, more data and more of the planet. As new checkpoints land, we will rerun these same tasks with the same protocol so the numbers stay comparable. A technical report and free global 10 m embeddings are on the way.
We are also giving a small group of partners early access to the Finch API, which returns embeddings for any place, date range and sensor at native resolution. You can request early access at locamage.com.
If you work with imagery and there is a place you want to understand better, email us at contact@locamage.com.
And if you are a researcher who would like to collaborate, we would love to hear from you at the same address.
Notes and acknowledgments
We trained Finch entirely on Google Cloud TPUs (v5e and v6e) with a JAX stack we built ourselves, covering the neural network library, checkpointing, optimizers and some general-purpose kernels. We plan to open-source it.
Thanks to a16z Speedrun Alpha for backing us, and to Google’s TPU Research Cloud and TPU Builder Program for the compute that made this possible.
Benchmarks and baselines: OlmoEarth v1, OlmoEarth v1.2, OlmoEarth v1.3, UniverSat, GEO-Bench-2, AlphaEarth Foundations, DINOv3 and TerraMind.
All posts