
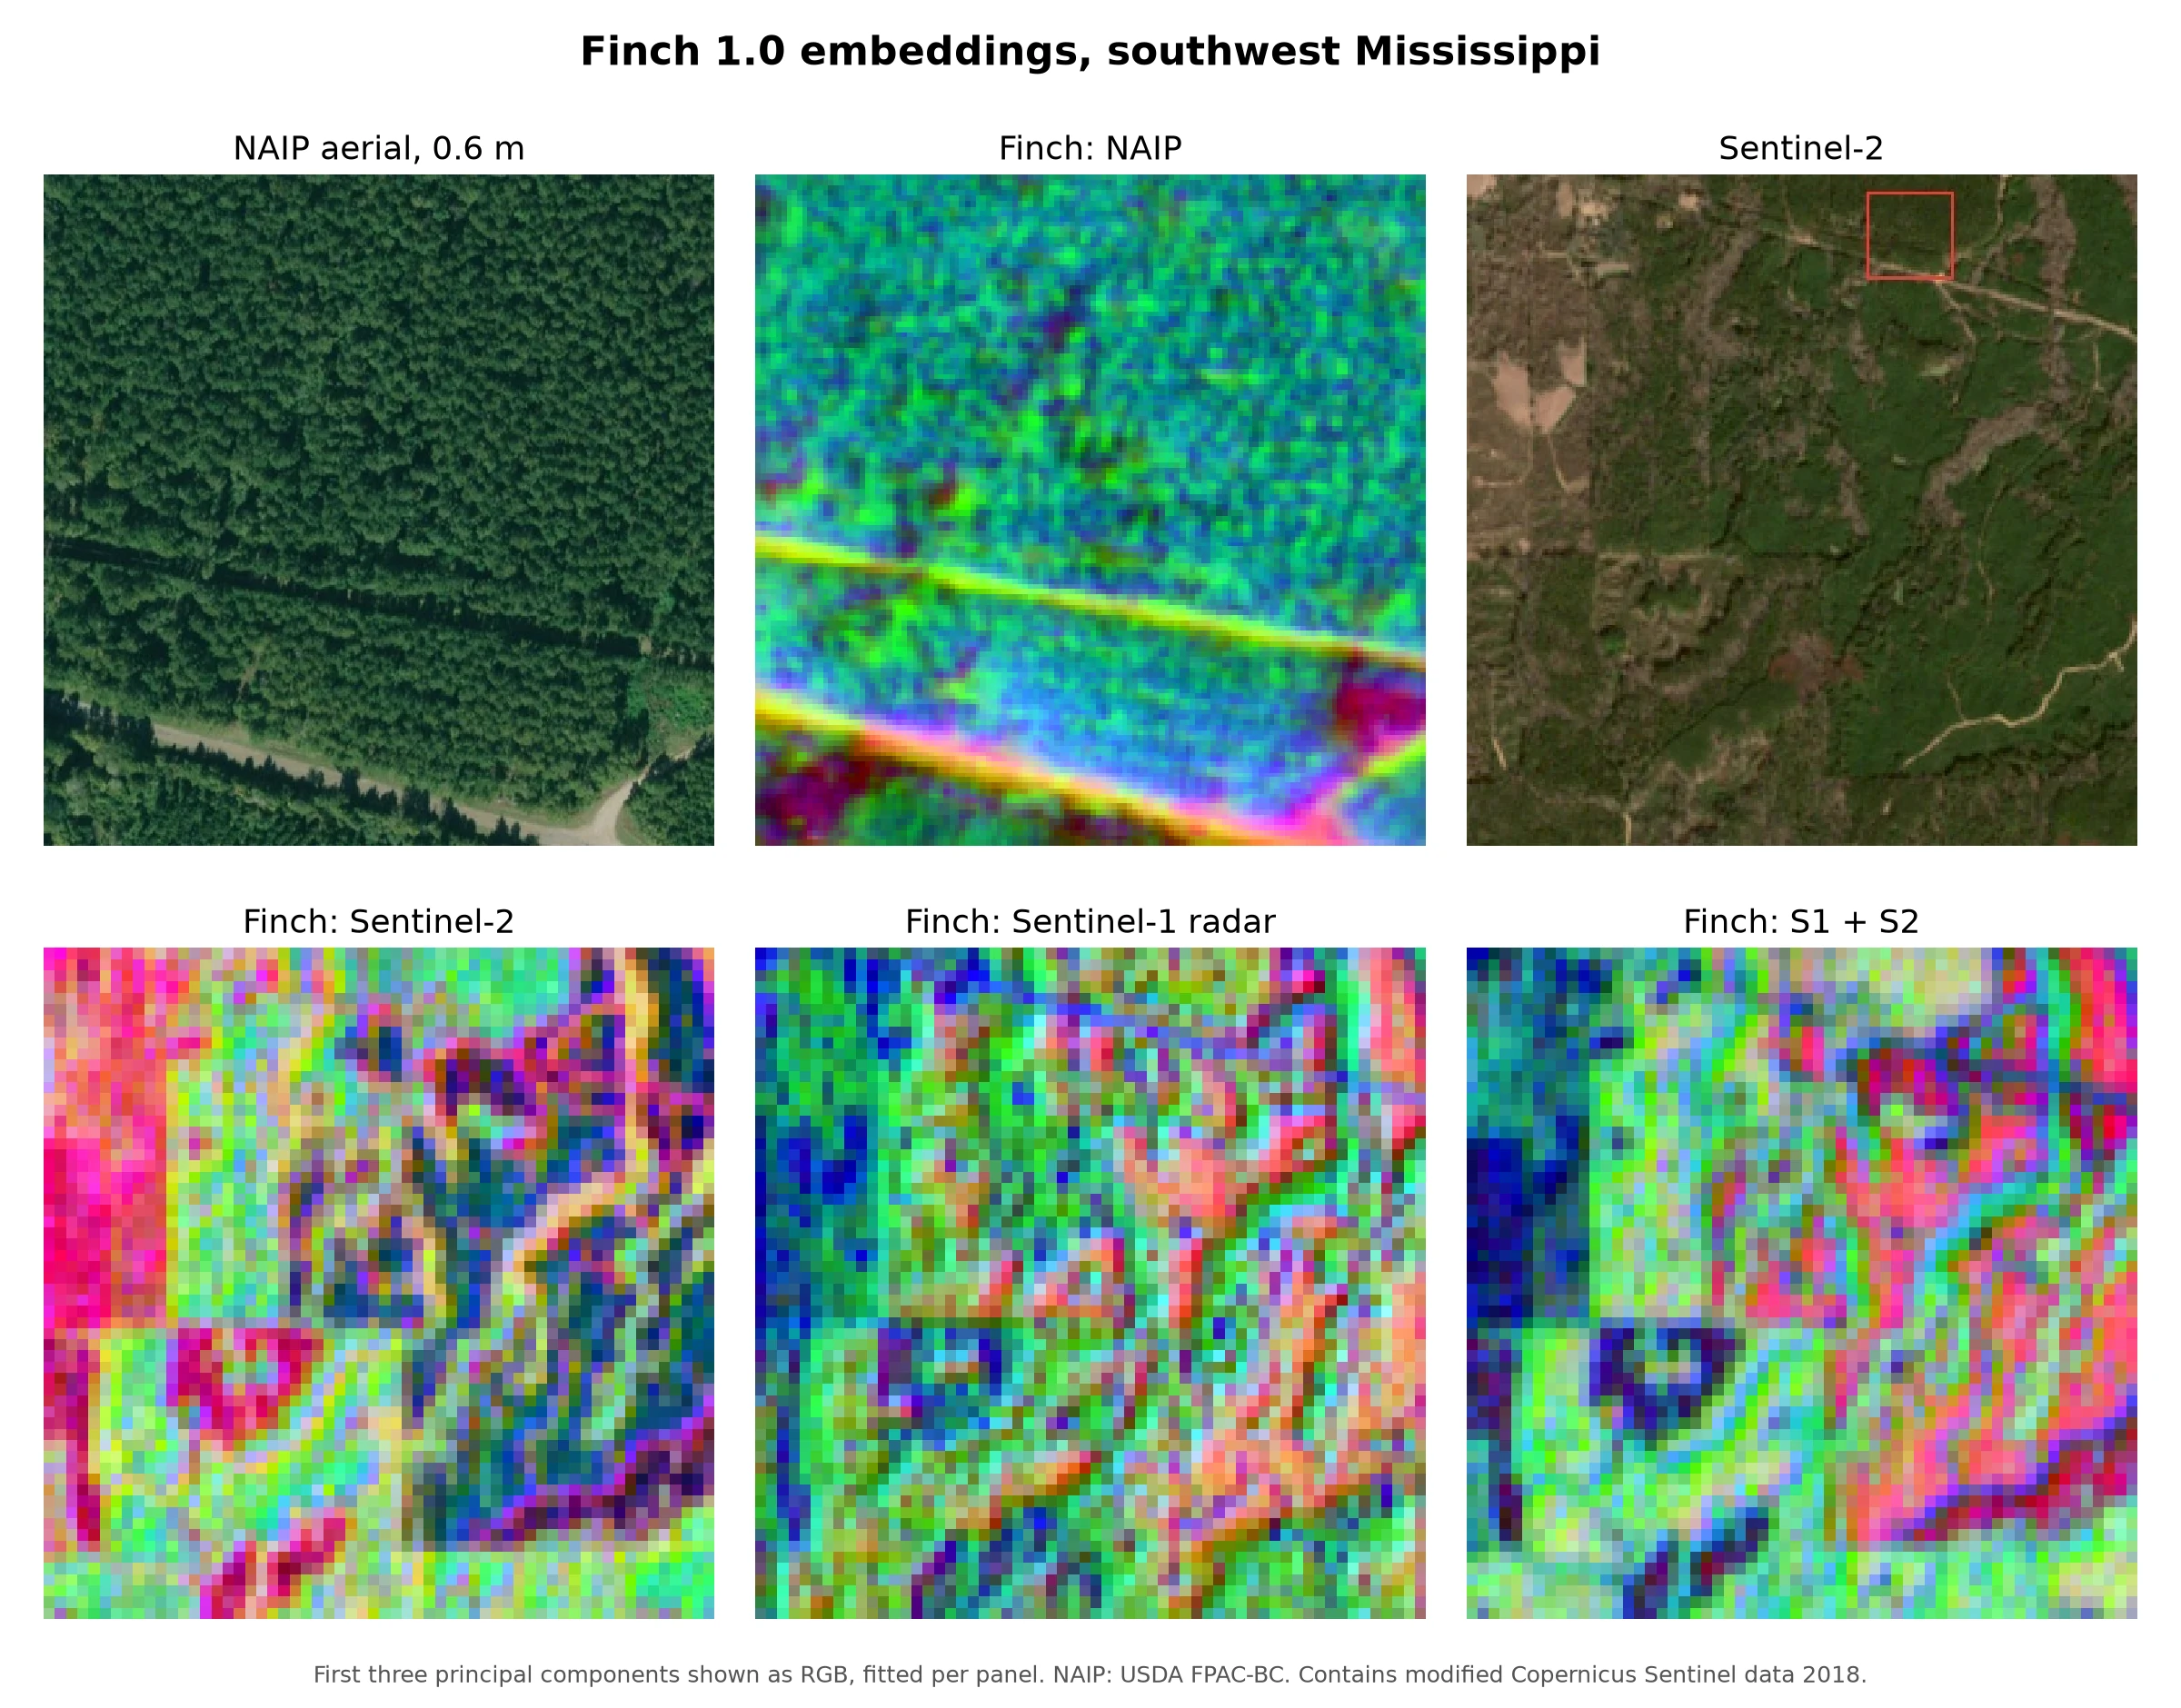
Today, on GIS Day, we are publishing the model card of Finch 1.0, the multimodal foundation model for Earth observation that we launched in October: a full evaluation on 34 public benchmark tasks, comparisons with the strongest open models, and reproductions of those models under our own pipeline.
Finch encodes imagery from 50 satellite, aerial and drone sensors at native resolution, from 0.1 m drone and aerial imagery to Sentinel-1 radar and Landsat, and produces 1024-dimensional embeddings. On those embeddings, a single linear layer or a nearest-neighbour classifier is enough to map crops, floods, buildings, forests and marine pollution.
With the model card, we are also releasing the Finch 1.0 embeddings of every sample of the 34 benchmark tasks we report, under CC BY 4.0, so that anyone can check our results and build on them.
Why one model for many sensors
Most Earth observation models support one sensor, or a small fixed set of sensors at fixed resolutions. In practice, the right sensor depends on the problem: radar sees through clouds, multispectral imagery separates crops and vegetation, and sub-metre aerial imagery resolves single buildings and trees. Teams that need several sensors usually maintain several models, each with its own pipeline.
Finch takes each input at its native resolution and gives embeddings in one shared space. It was pretrained on imagery alone. Its pretraining used no labelled map data, such as OpenStreetMap or land-cover and crop maps, and no labels from any evaluation benchmark.
Results
We evaluated Finch on 34 tasks from three public benchmark suites: the 18 tasks of the OlmoEarth suite, the 11 tasks of the UniverSat suite, and five high-resolution tasks from GEO-Bench-2. In every evaluation the encoder is frozen and only a lightweight readout is trained: a k-nearest-neighbour classifier or a single linear layer, as each task's published protocol specifies.
Cropland from radar alone. On CropHarvest China, Finch classifies crop and non-crop locations from Sentinel-1 radar alone with 70.8% accuracy. The best published result on this task is 63.7 (OlmoEarth v1.2 Nano), and our own evaluation of OlmoEarth v1.3 Base gives 67.0. Radar is the only reliable source of imagery in regions where clouds cover the growing season.
Marine debris and oil spills. On MADOS, the segmentation of marine debris, oil spills and other sea-surface features into 15 classes, Finch achieves 72.0 mIoU, against 68.5 for the best published model (OlmoEarth v1.1 Base).
High-resolution land cover with a linear layer. On DynamicEarthNet land-cover segmentation from daily PlanetScope imagery, a linear layer on Finch embeddings scores 32.9 mIoU. The best frozen encoder on the GEO-Bench-2 leaderboard scores 31.7 with a trained UNet decoder of about 15 to 20 million parameters, averaged over five runs. On CloudSEN12+ cloud and cloud-shadow segmentation, Finch scores 63.7 against 63.5 for the best frozen encoder with a UNet decoder.
On par across the suites. Over the 18 OlmoEarth tasks, Finch averages 65.1, against published means of 65.5 for OlmoEarth v1.3 Base and 65.8 for OlmoEarth v1.2 Base. Over the nine UniverSat tasks with published UniverSat-B results, Finch averages 65.9 against 66.1. We also ran these baselines through our own evaluation pipeline, with the same data, splits and readouts: Finch averages 65.1 against 65.4 for OlmoEarth v1.3 Base, and 65.9 against 65.6 for UniverSat-B. The model card gives every task for every model.
| Finch 1.0 | Best published | |
|---|---|---|
| CropHarvest China, Sentinel-1 only (accuracy) | 70.8 | 63.7 (OlmoEarth v1.2 Nano) |
| MADOS (mIoU) | 72.0 | 68.5 (OlmoEarth v1.1 Base) |
| DynamicEarthNet, linear vs. frozen + UNet (mIoU) | 32.9 | 31.7 (TerraMind v1 Large) |
| OlmoEarth suite, 18 tasks (mean) | 65.1 | 65.8 (OlmoEarth v1.2 Base) |
| UniverSat suite, 9 tasks (mean) | 65.9 | 66.1 (UniverSat-B) |
Finch does not lead everywhere. Other models hold the best published results on CropHarvest Togo, PASTIS crop segmentation, Burn Scars and several GEO-Bench-2 tasks, and the model card reports all of them.
Sensors Finch has never seen
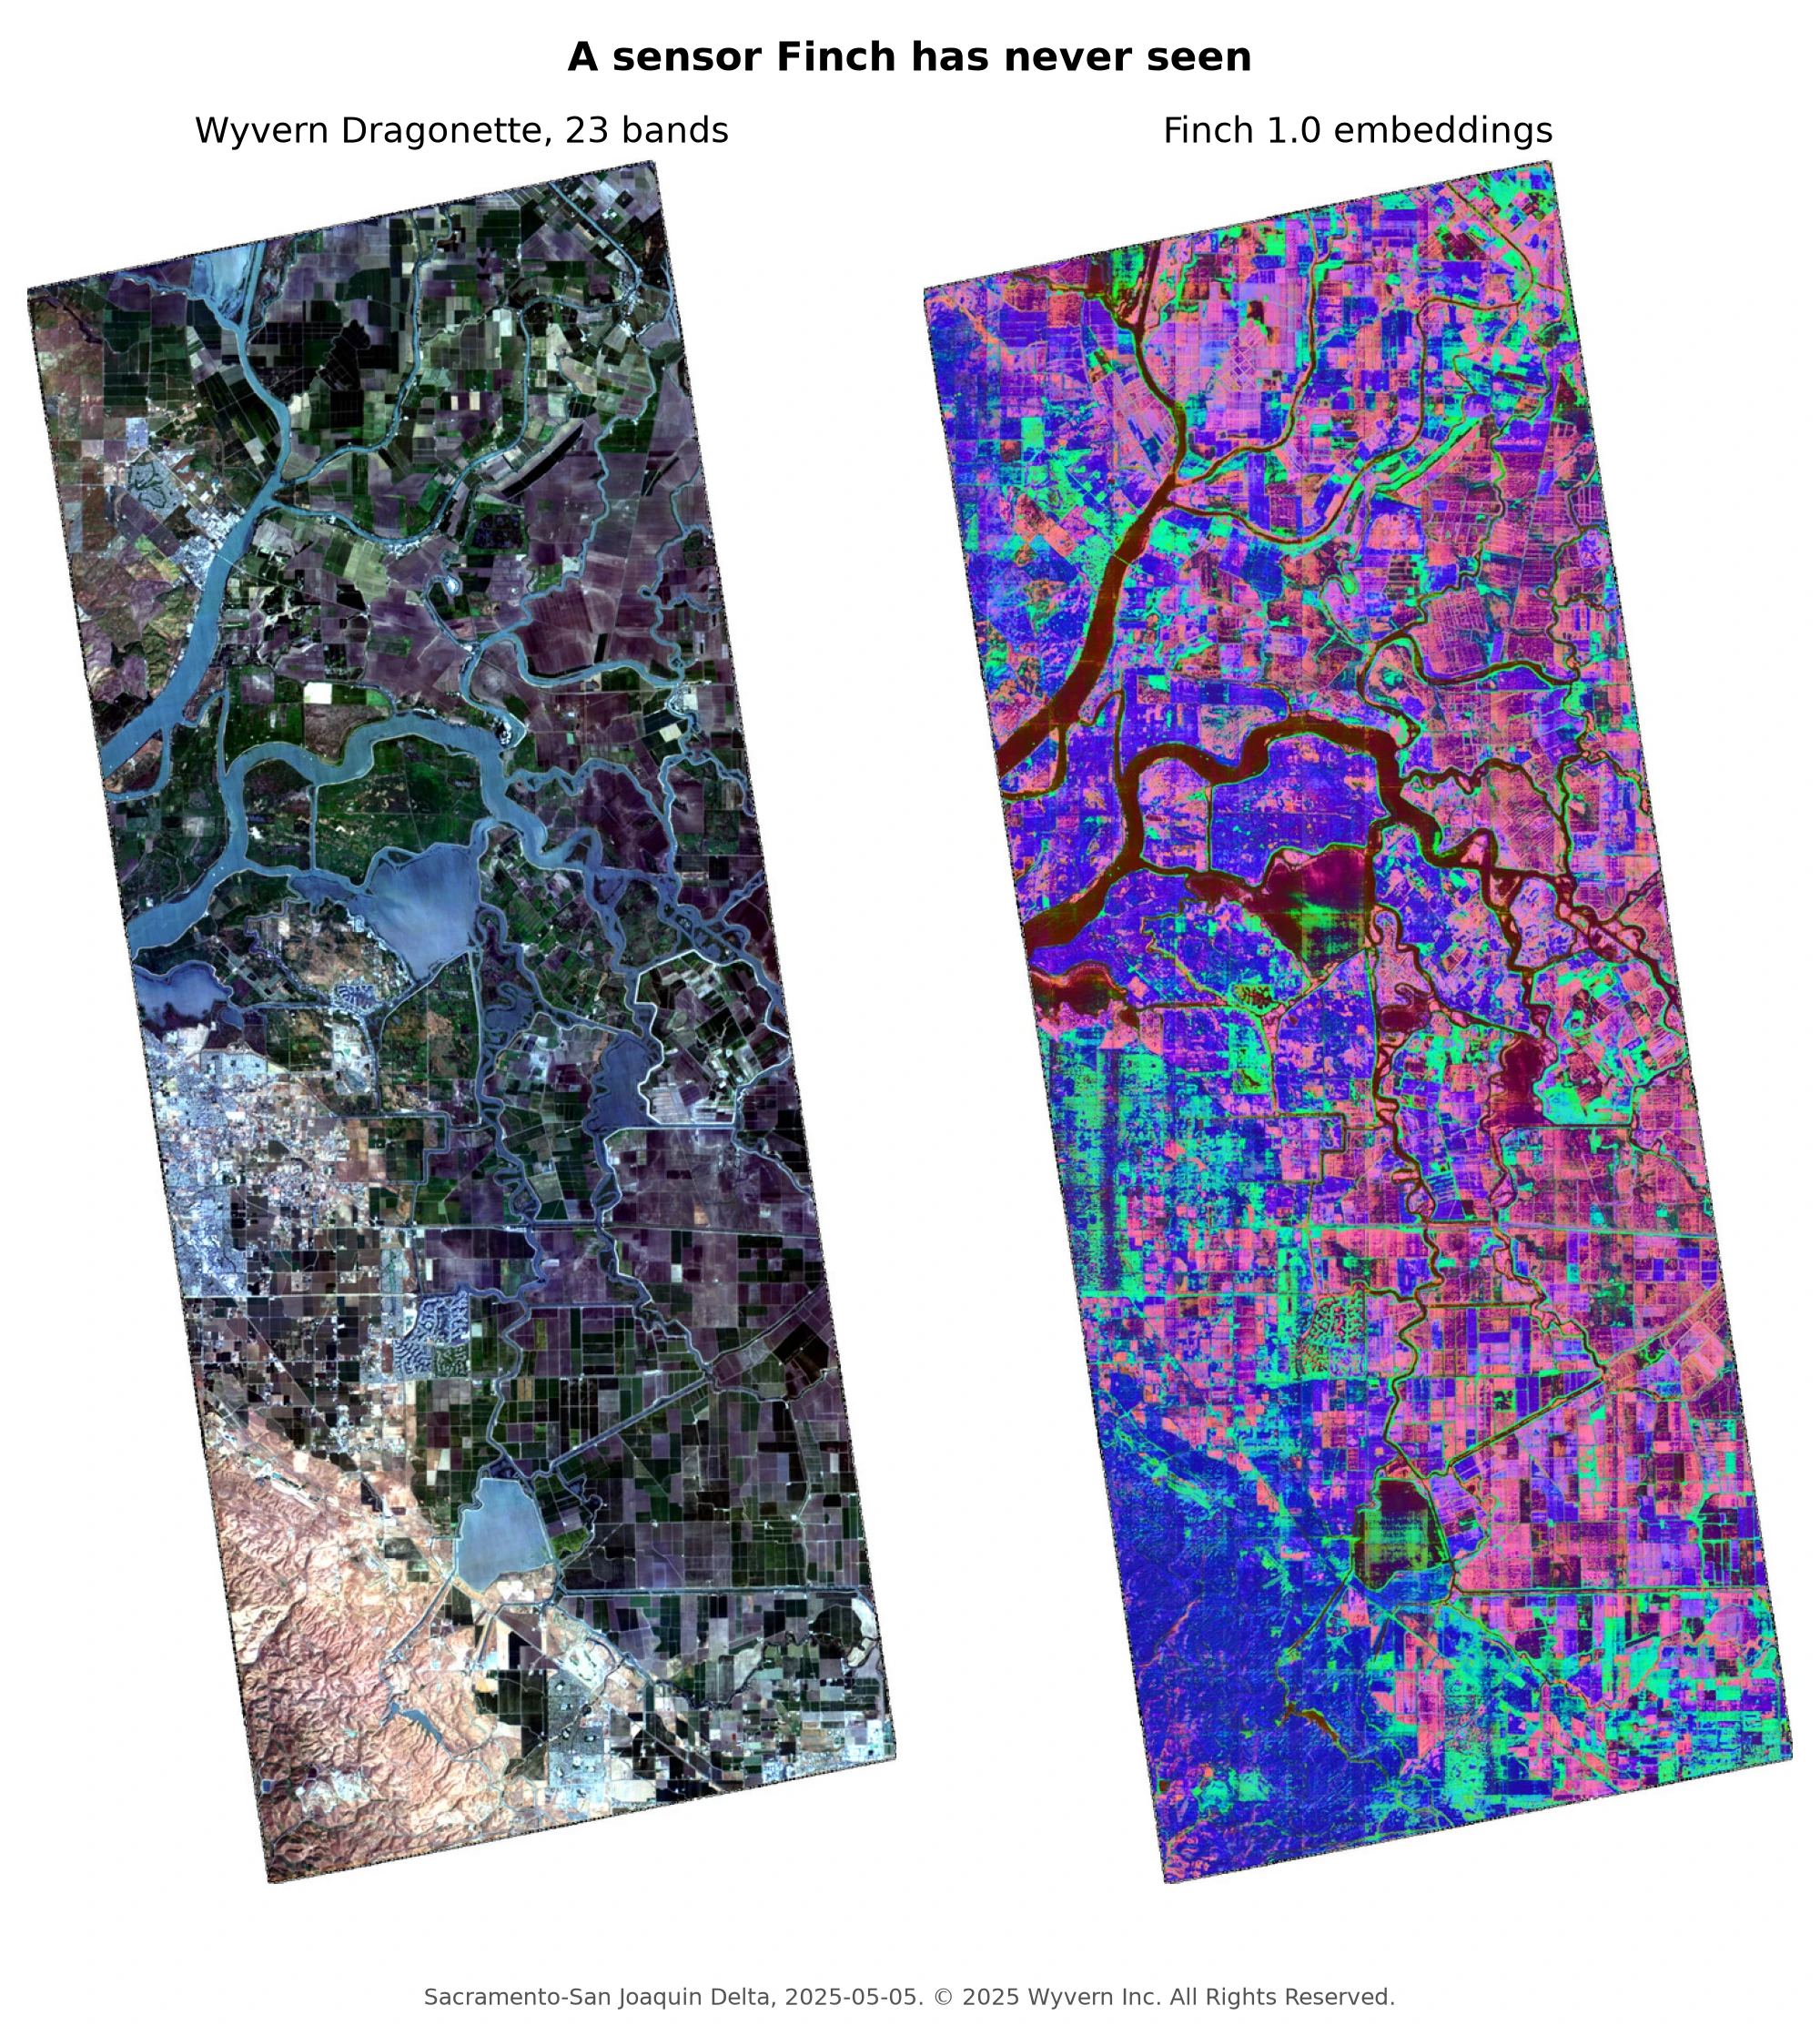
Finch accepts sensors that were not in its training data. On NeonTree tree-crown segmentation from the 369-band NEON imaging spectrometer alone, Finch scores 46.9 test mIoU, the same as UniverSat-B, which was pretrained on that sensor. The model card also shows embedding maps of Wyvern hyperspectral imagery and 0.25 m ICEYE X-band radar, two more sensors that Finch has never seen. Those maps are demonstrations, not scored evaluations.
The embedding release
We are releasing one embedding dataset per benchmark task: the embeddings of every train, validation and test sample of the 34 core tasks, 207.6 GB in total, under the Creative Commons Attribution 4.0 licence.
- Each task is a Lance dataset at
https://embeddings.locamage.com/<benchmark>/<task>.lance. - Each row holds the split, the sample identifier of the original dataset, the tile and the embedding, so it joins directly with the labels of the original benchmark.
- Each dataset is bit-identical to the embeddings we used for the results in the model card.
manifest.jsonlists every file with its size and SHA-256 checksum.
import hashlib, json, pathlib
import lance, numpy as np, requests

BASE, TASK = "https://embeddings.locamage.com", "olmoearth/m-eurosat"
manifest = requests.get(f"{BASE}/manifest.json").json()
for entry in manifest["tasks"][TASK]["files"]:
    data = requests.get(f"{BASE}/{entry['path']}").content
    assert hashlib.sha256(data).hexdigest() == entry["sha256"]
    path = pathlib.Path("finch-1.0") / entry["path"]
    path.parent.mkdir(parents=True, exist_ok=True)
    path.write_bytes(data)

dataset = lance.dataset(f"finch-1.0/{TASK}.lance")
shape = json.loads(dataset.schema.metadata[b"shape"])
table = dataset.to_table(filter="split = 'train'")
embeddings = np.stack(table["embedding"].to_numpy(zero_copy_only=False)).reshape(-1, *shape)
Train a probe on the training split, select on validation and score on test, or try a readout of your own. Finch 1.0 itself is proprietary: the release contains the embeddings of these benchmark samples, not the model weights or embeddings of other places.
How we built it
Finch was developed on our own stack: a scheduler built on components of the open-source Marin project, datamage, our Rust data loader, and jaxmage, our JAX library of layers, optimizers and kernels, which we plan to release as open source. Every result in the model card is traceable to the model code stored with its checkpoint. We thank Google's TPU Research Cloud and TPU Builder Program for the compute that made this work possible.
Read more
The model card describes the evaluation protocol, every result of every task, the reproductions of the baselines, and the release in detail. If you work on agriculture, disaster response, environmental monitoring or conservation and want to use Finch on your own imagery, contact us at contact@locamage.com.
All posts