
Yesterday we shared the benchmark results for Finch 1. Today we want to show what those numbers look like on the ground.
Every image below comes from evaluation data in a public benchmark, held out from training. Finch stays frozen, and a single linear layer turns its embeddings into a map. The examples run from 20 cm aerial photos to 30 m satellite imagery.
 ImageryFinch 1
FLAIR2
Land cover, France
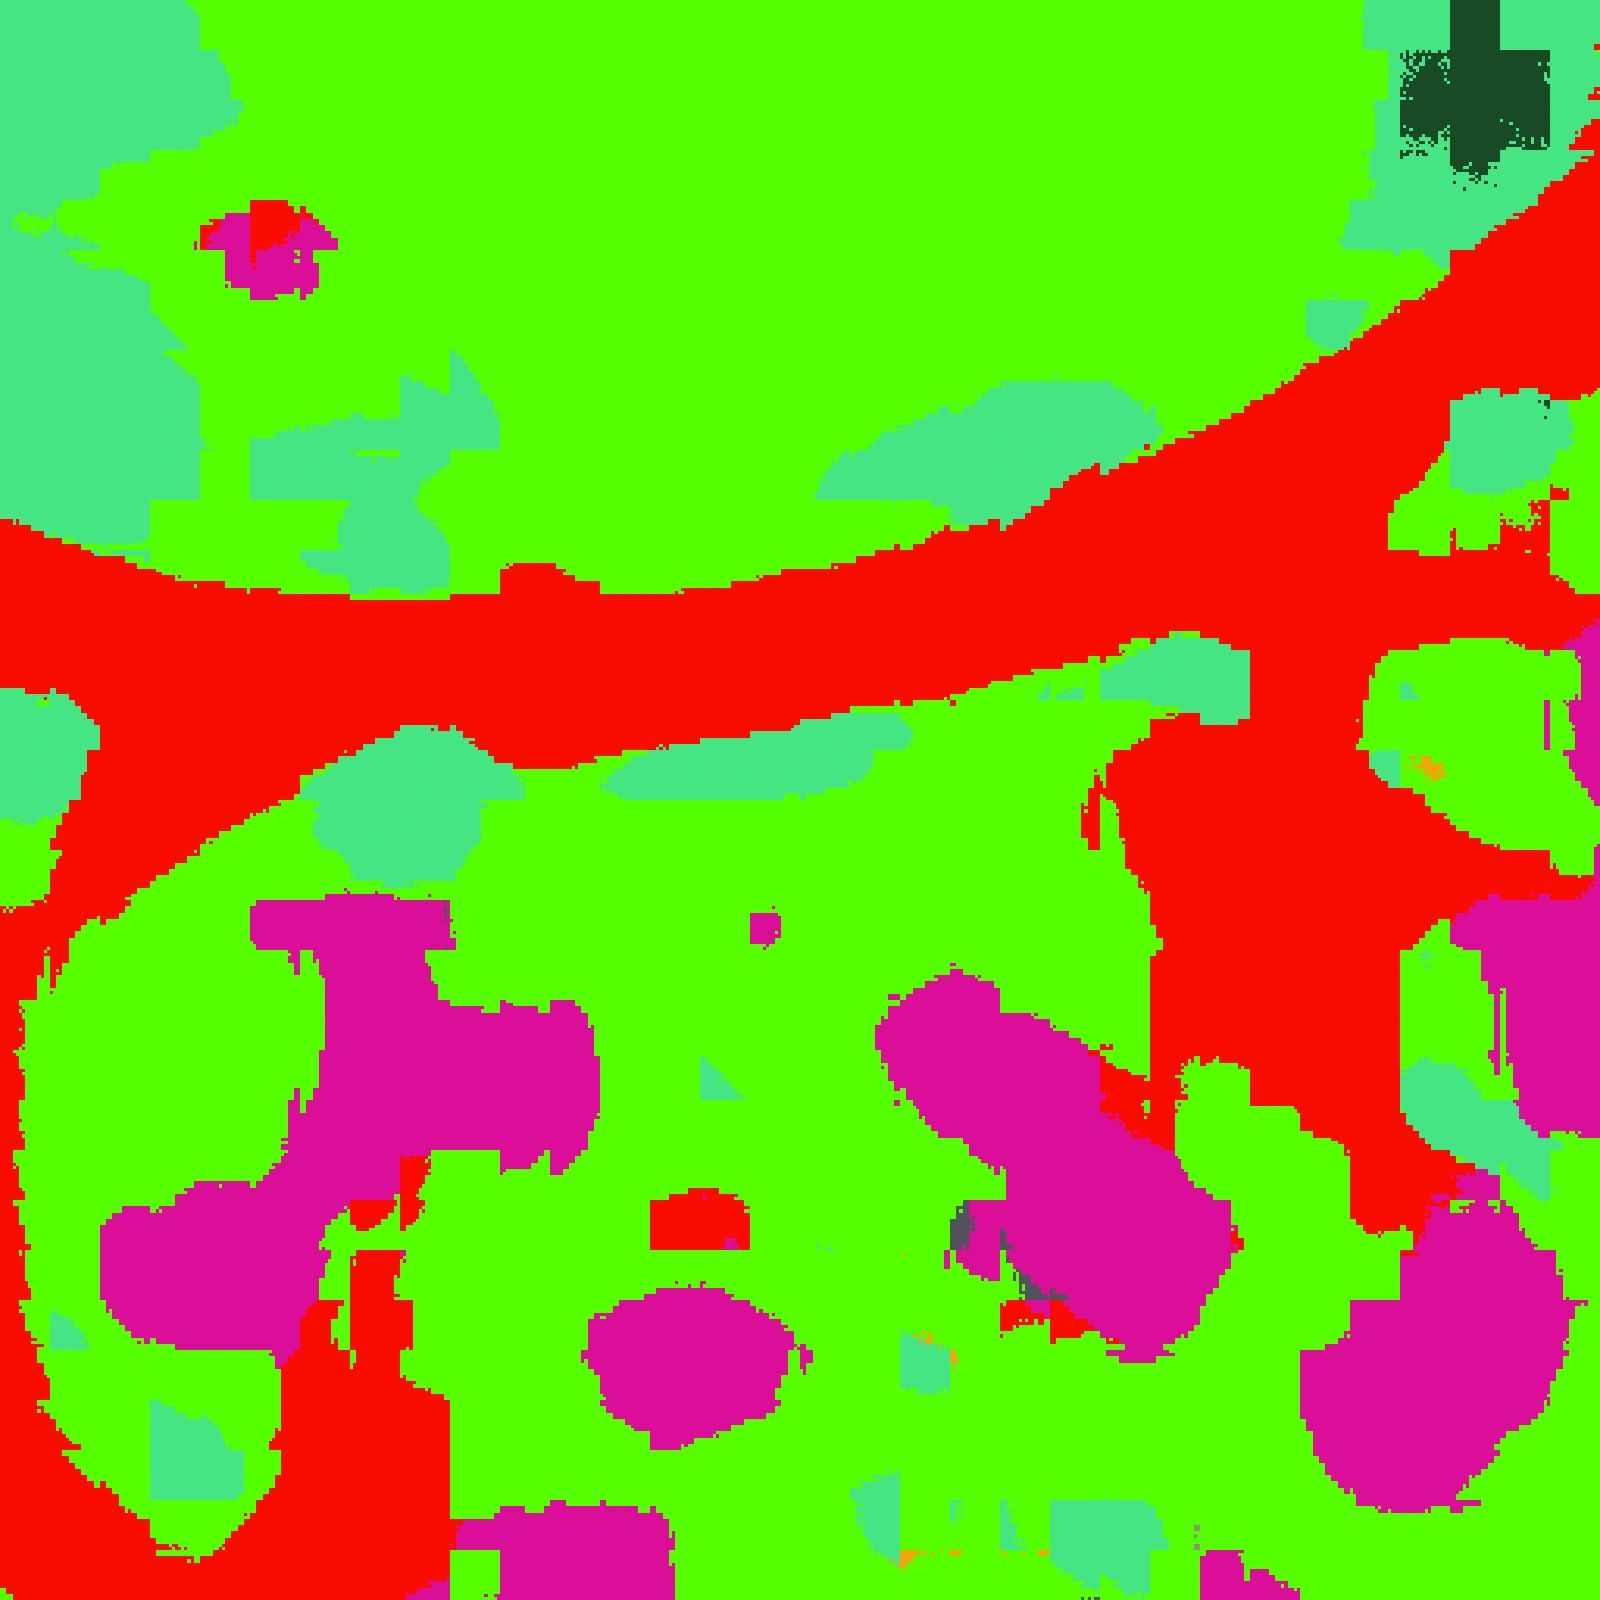
building
pervious surface
impervious surface
coniferous
deciduous
brushwood
herbaceous vegetation
agricultural land
other
Drag the image to compare.
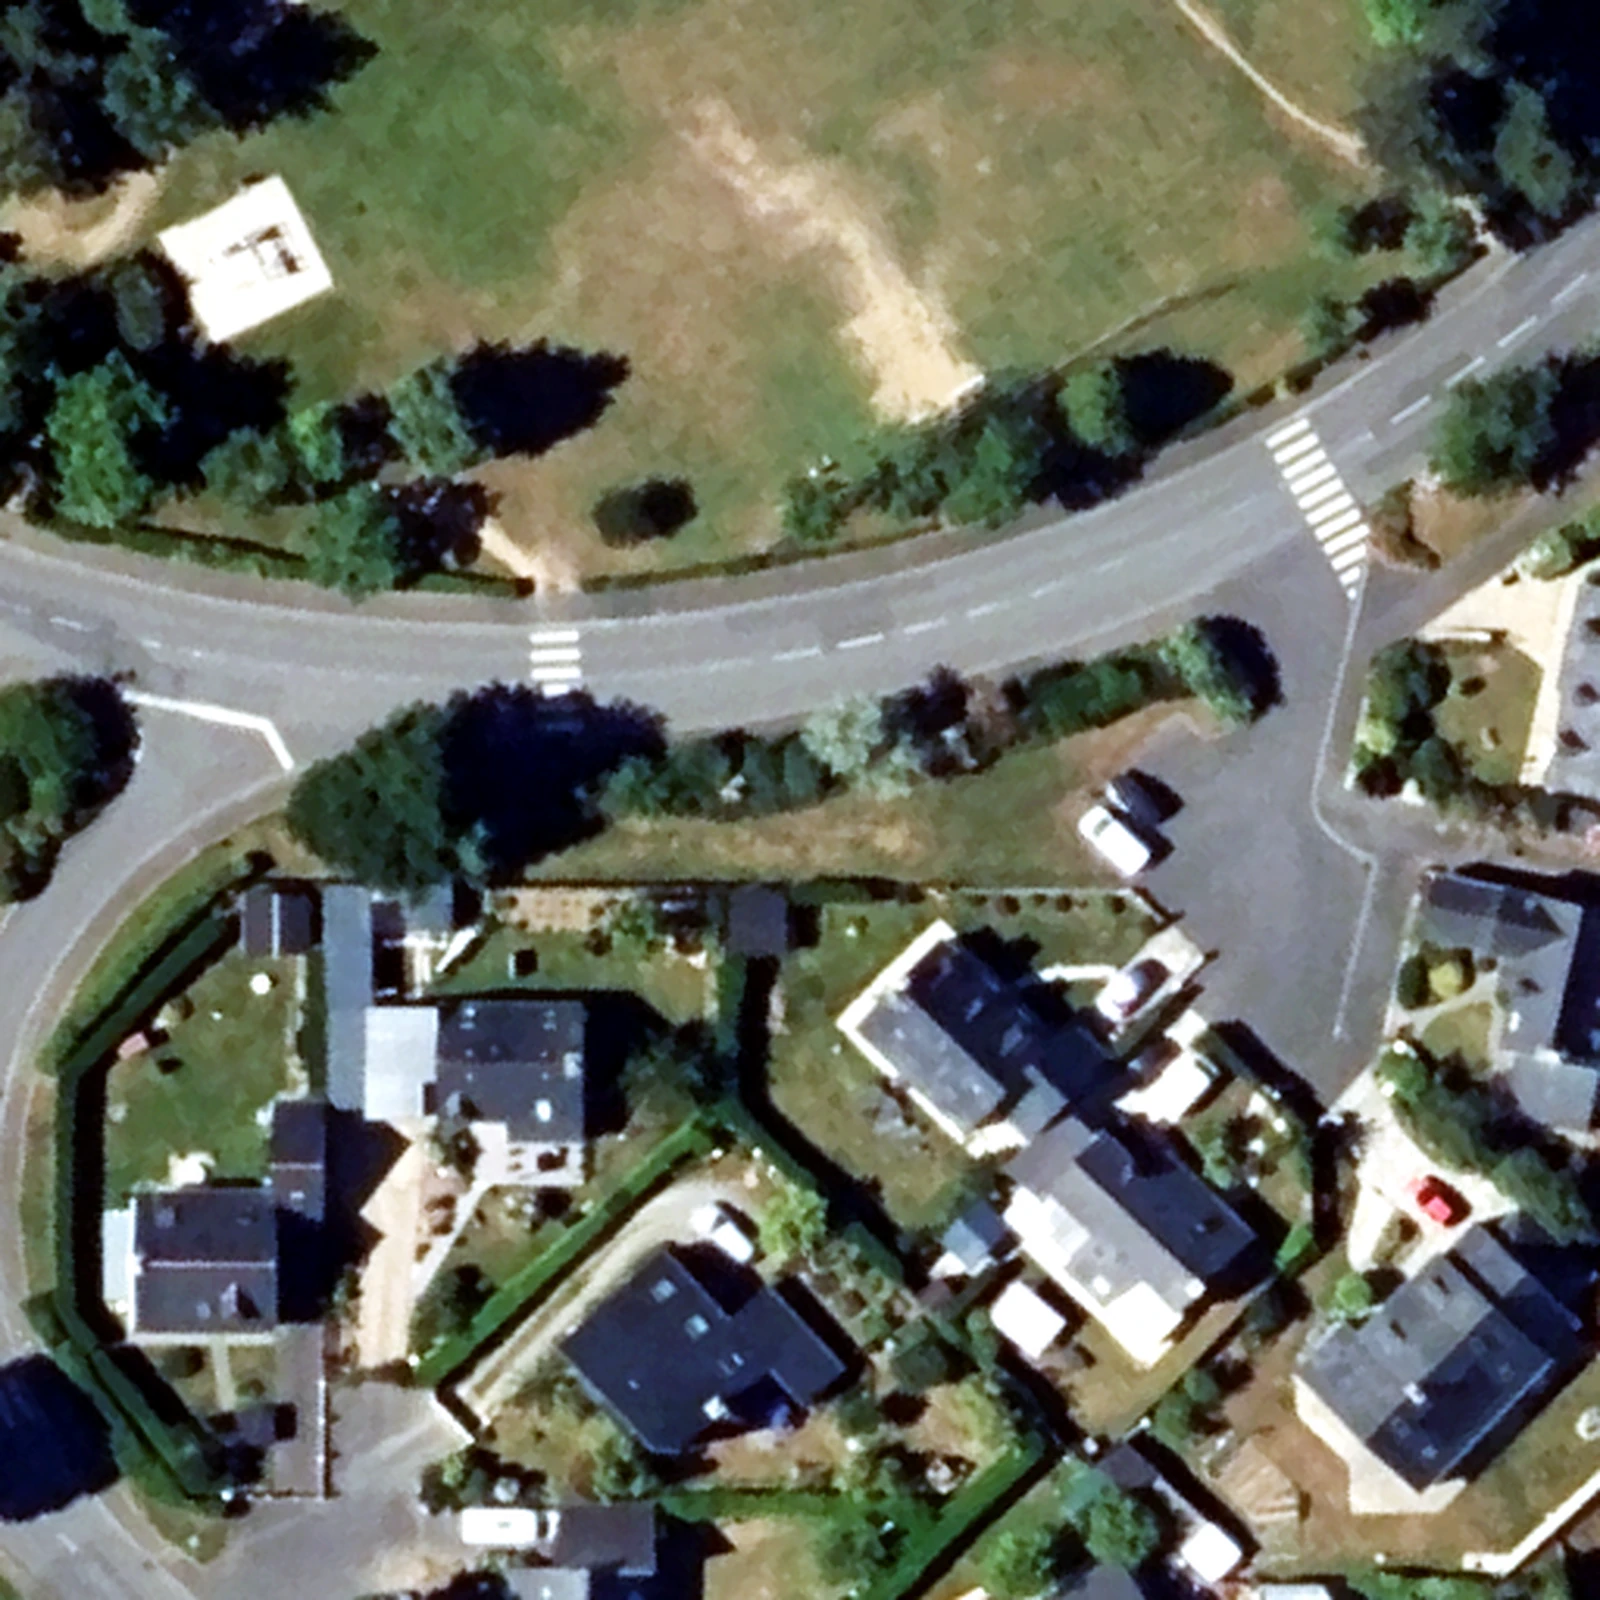
Land cover in France. In 20 cm aerial photos (FLAIR2), Finch maps roofs, roads, trees and lawns in a single pass.
Buildings. In WorldView-3 satellite imagery of Khartoum (SpaceNet2), Finch traces building footprints block by block.
Land cover in the US. In 1 m NAIP aerial imagery from the Chesapeake Bay region (m-Chesapeake), Finch separates roads, roofs, tree canopy and fields.
Burn scars. In 30 m Sentinel-2 imagery (HLS Burn Scars), Finch picks out where a wildfire burned.
Tomorrow we will show Finch tracking change over time. The full results and how we compared are in the launch post.
Benchmarks: GEO-Bench, GEO-Bench-2, FLAIR, SpaceNet, Chesapeake Land Cover and HLS Burn Scars.
All posts